EGF Consistency Correlates with High-Density
Bipolar Voltage Maps in Sinus Rhythm and AF
David Haines, MD, Steven Castellano, PhD, Melissa Kong, MD, Philipp Sommer, MD
Background
In patients with atrial fibrillation (AF), left atrial scar revealed by low voltage areas on 3D
electroanatomic mapping have been correlated with scar on late gadolinium enhanced cardiac magnetic resonance imaging, which is recognized as a surrogate for fibrosis. Electrographic Flow (EGF) mapping reconstructs global atrial wavefront propagations in near real-time. Electrographic flow consistency (EGFC) quantifies concordance of observed wavefront patterns and may provide insight into the nature of atrial substrate where diseased substrate shows more chaotic wavefront propagation and lower FC.
Objectives
Correlate EGFC with regional bipolar voltage values in patients during AF and sinus rhythm (SR).
Methods
FLOW EVAL-AF is a single-center, prospective study of 10 AF patients who underwent concomitant high-density bipolar voltage mapping with HD Grid and EGF mapping with 64-pole basket catheter. Biatrial voltage maps and 1-minute EGF maps from 2-3 standard basket positions per atria were made prior to any induction or ablation. Atrial surface area with voltage >0.5 mV was computed from 2D voltage map projections. EGF fields computed per 2-sec segment of recording. Overall EGFC per atrium computed as
average of the modulus of individual EGF vectors, where vector length represents consistency of flow patterns in arbitrary units. We compared % atrial surface area with normal voltage v. mean EGFC across EGF recordings per atria in a given rhythm.
Results
Data from 8 patients (2 AF; 6 SR) was analyzed; 2 excluded for non-comparable voltage map acquisition parameters. Mean age 70±11 years; 1 female; mean LA size 4.5±0.35 cm. Surface area % with voltage 0.5 mV was 0.24±0.08 in AF v. 0.36±0.05 in SR. Mean EGFC in AF 0.74±0.14 and in SR 1.0±0.11.
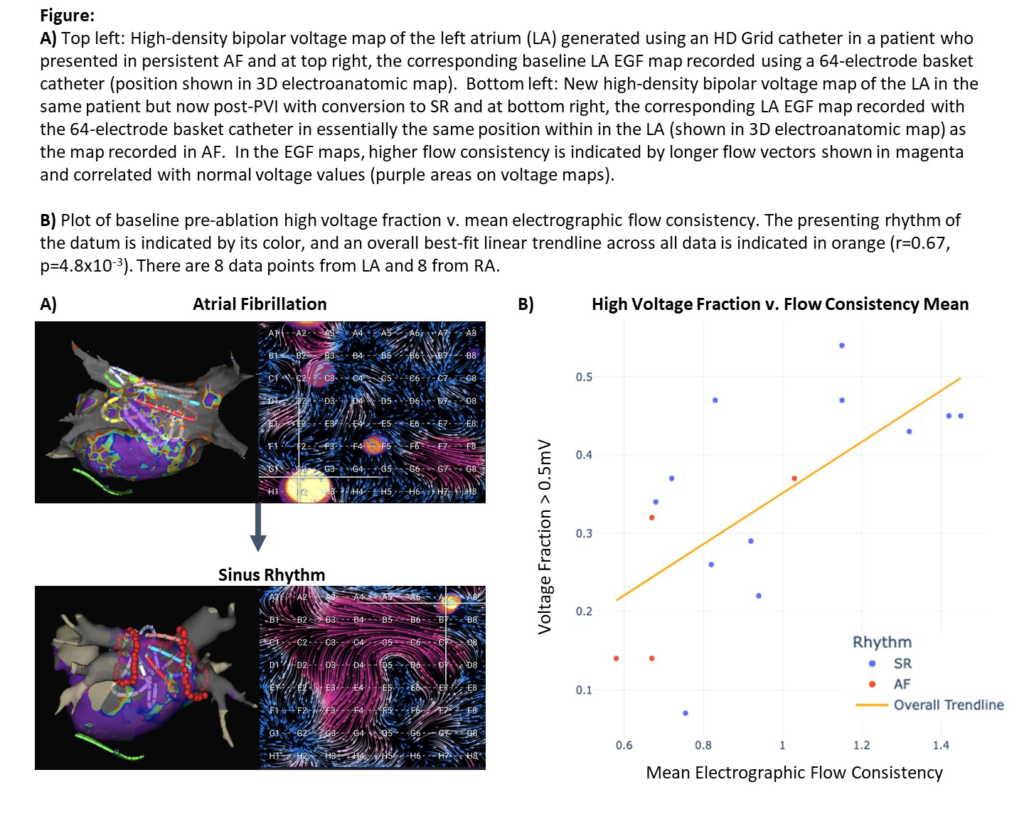
Intraprocedural rhythm change occurred in 5 (3 induced into AF; 2 converted to SR post-PVI), and all had higher voltage values overall and higher mean EGFC in SR v. AF. Pooling data from all pre-procedure voltage maps and EGF maps revealed overall correlation between EGFC and bipolar voltage from both atria and in both rhythms (r=0.67, p=4.8×10⁻³).
Conclusions
Both EGFC and bipolar voltage values were higher in SR v. AF. EGFC correlated with voltage across both atria and in both SR and AF. Global EGFC can be obtained with 1-minute recordings in 2-3 basket positions per atria and may provide another measure of the degree of atrial myopathy similar to the information gained from high-density bipolar voltage mapping.