John Hummel, MD; Steven Castellano, PhD; Phillip Haeusser, PhD; Melissa Kong, MD
Background
When atrial fibrillation (AF) is organized whether by medication or ablation, it can become difficult to discriminate from atrial flutters (AFL) and tachycardias (AT). Electrographic Flow (EGF) mapping displays global atrial wavefront propagations in near real-time. Patterns of EGF can show regions of stable flow direction over time (electrographic flow consistency, EGFC) or disorganized electrical wavefronts (flow angle variability, FAV).
Objectives
Evaluate EGF patterns and metrics that may be used to successfully differentiate endocardial activations of various atrial arrhythmias.
Methods
From 183 patients who underwent EGF mapping with a 64-pole basket catheter, 3,030 one minute recordings were analyzed to establish independent metrics that varied most significantly across different atrial arrhythmias. Principal Component Analysis was used to visualize separability of an equal number of recordings in each rhythm using only the 4 most significant metrics. Classification performance was assessed using a 3 layer convolutional neural network (CNN) trained with a rectified linear activation function, categorical cross-entropy loss function, and Adam optimization algorithm.
64% of metrics were used for training, 16% for cross-validation, and the remaining 20% for testing and determining prediction accuracy.
Results
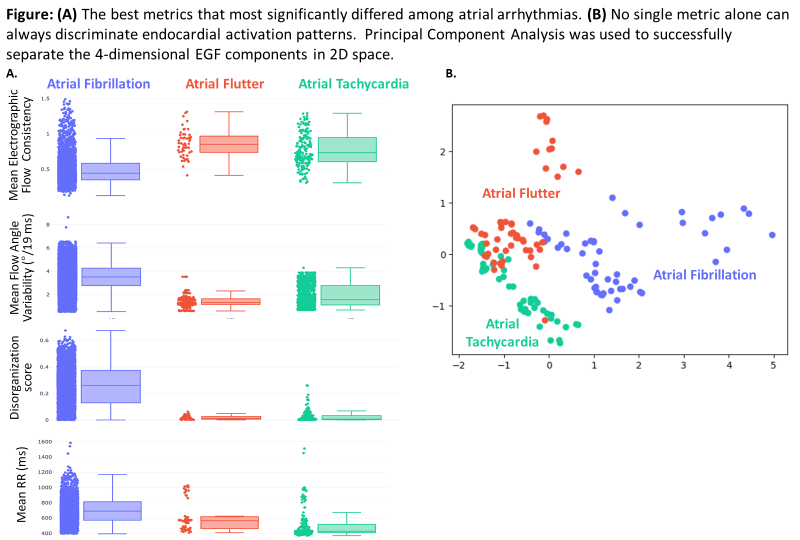
Mean EGFC, FAV, RR interval and a local disorganization score computed based on the maximum cross-correlation between consecutive pairs of RR intervals on each of 64 basket electrodes, were found to be the best metrics for discriminating among atrial arrhythmias (A). Mean EGFC and mean FAV varied the most between AF and AFL (p=5.24×10⁻¹⁹ and p=5.37×10⁻³⁴, respectively) while disorganization score and
mean RR interval varied the most between AF and AT (p=5.32=10-235 and p=1.25×10⁻⁷, respectively).
The CNN was able to accurately determine the rhythm from previously unseen samples with 81% accuracy when given only these 4 metrics. It also was 100% successful at distinguishing all instances of AF from AT though there was some overlap between AFL and AT (B).
Conclusions
Summative EGF metrics that characterize vector flow provide signature patterns of global atrial wavefront propagations in different atrial arrhythmias that can be used to successfully discriminate
these arrhythmias.